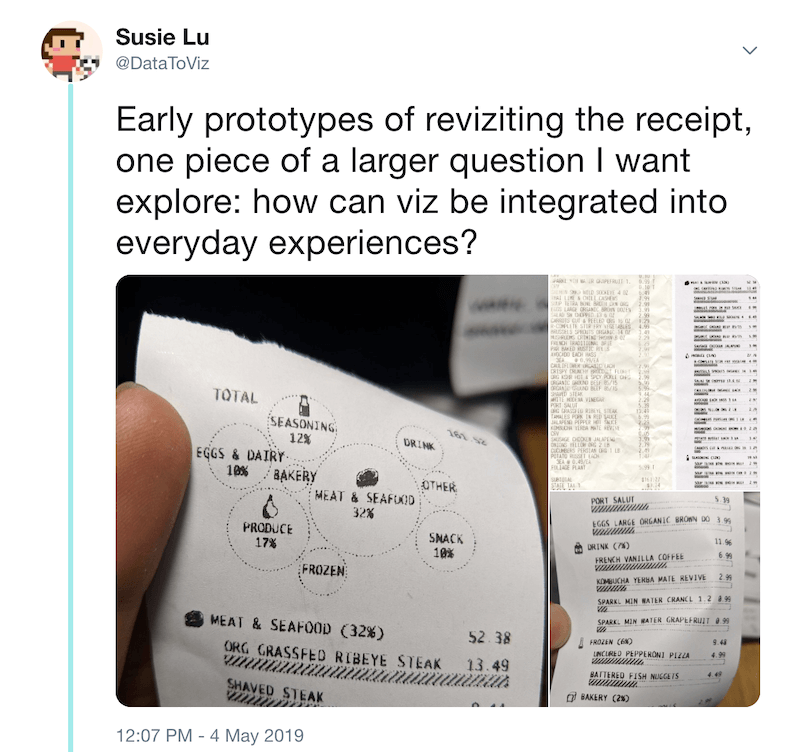
A summary of the design, the process, and the reception of a side project where I re-designed the receipt with data visualization.
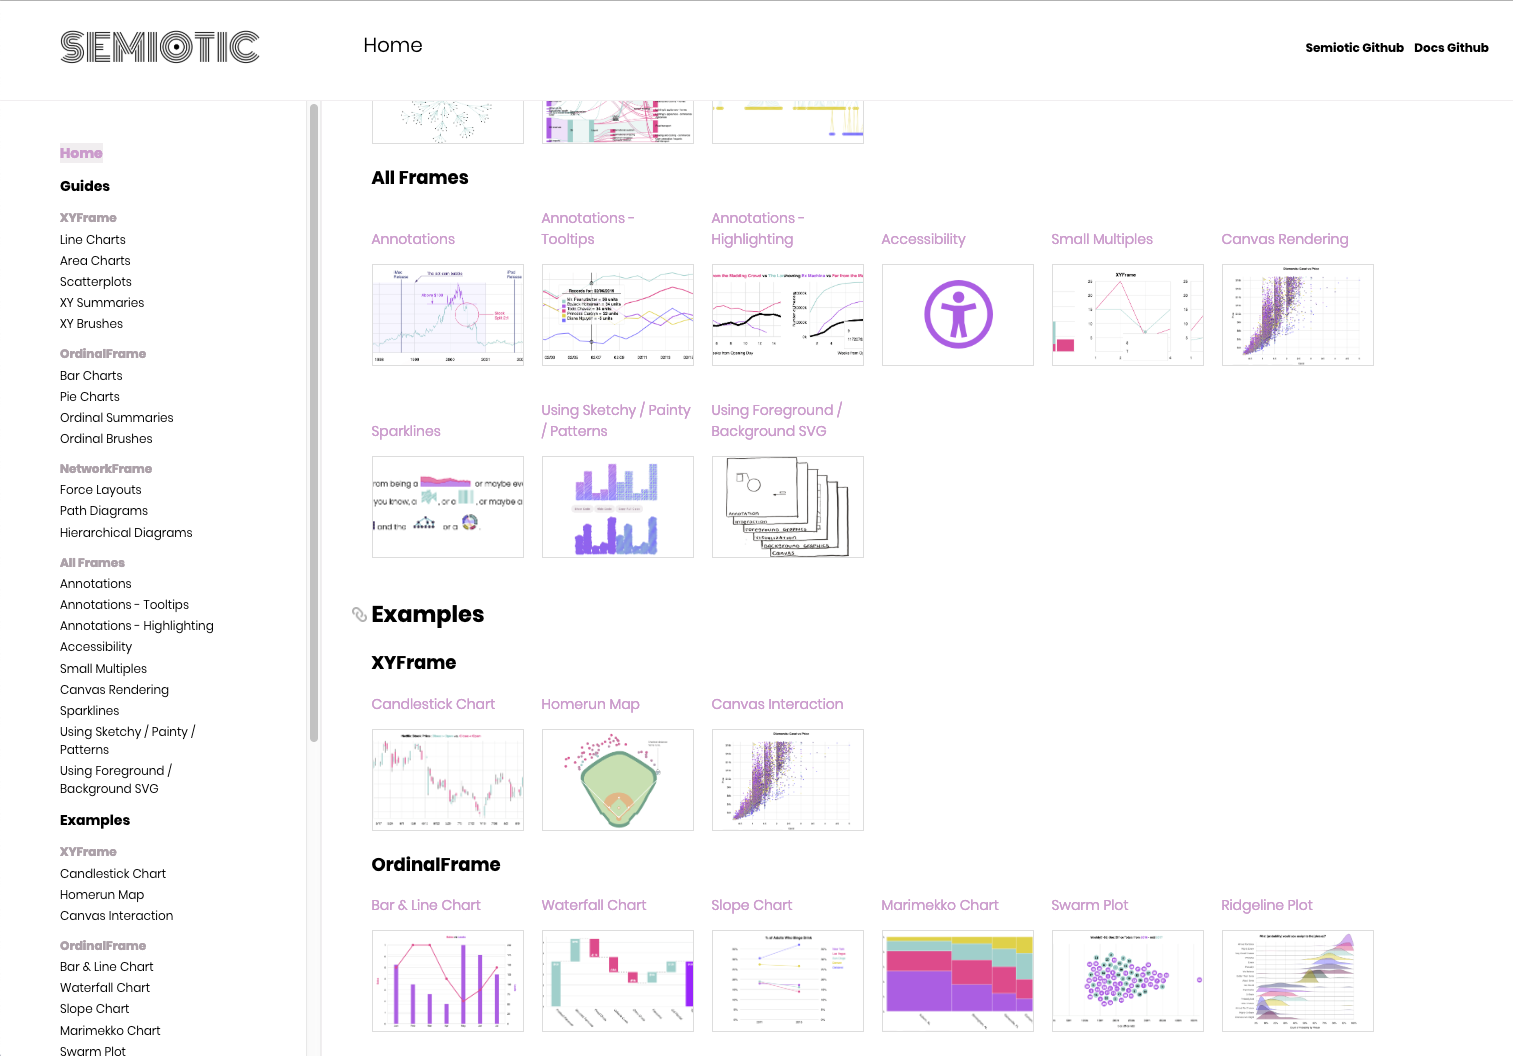
Semiotic Docs
v2 Release
Designed and implemented the remake of Semiotic's Documentation site. Semiotic is a React data visualization library created by Elijah Meeks used extensively in the visualization apps on our team at Netflix.
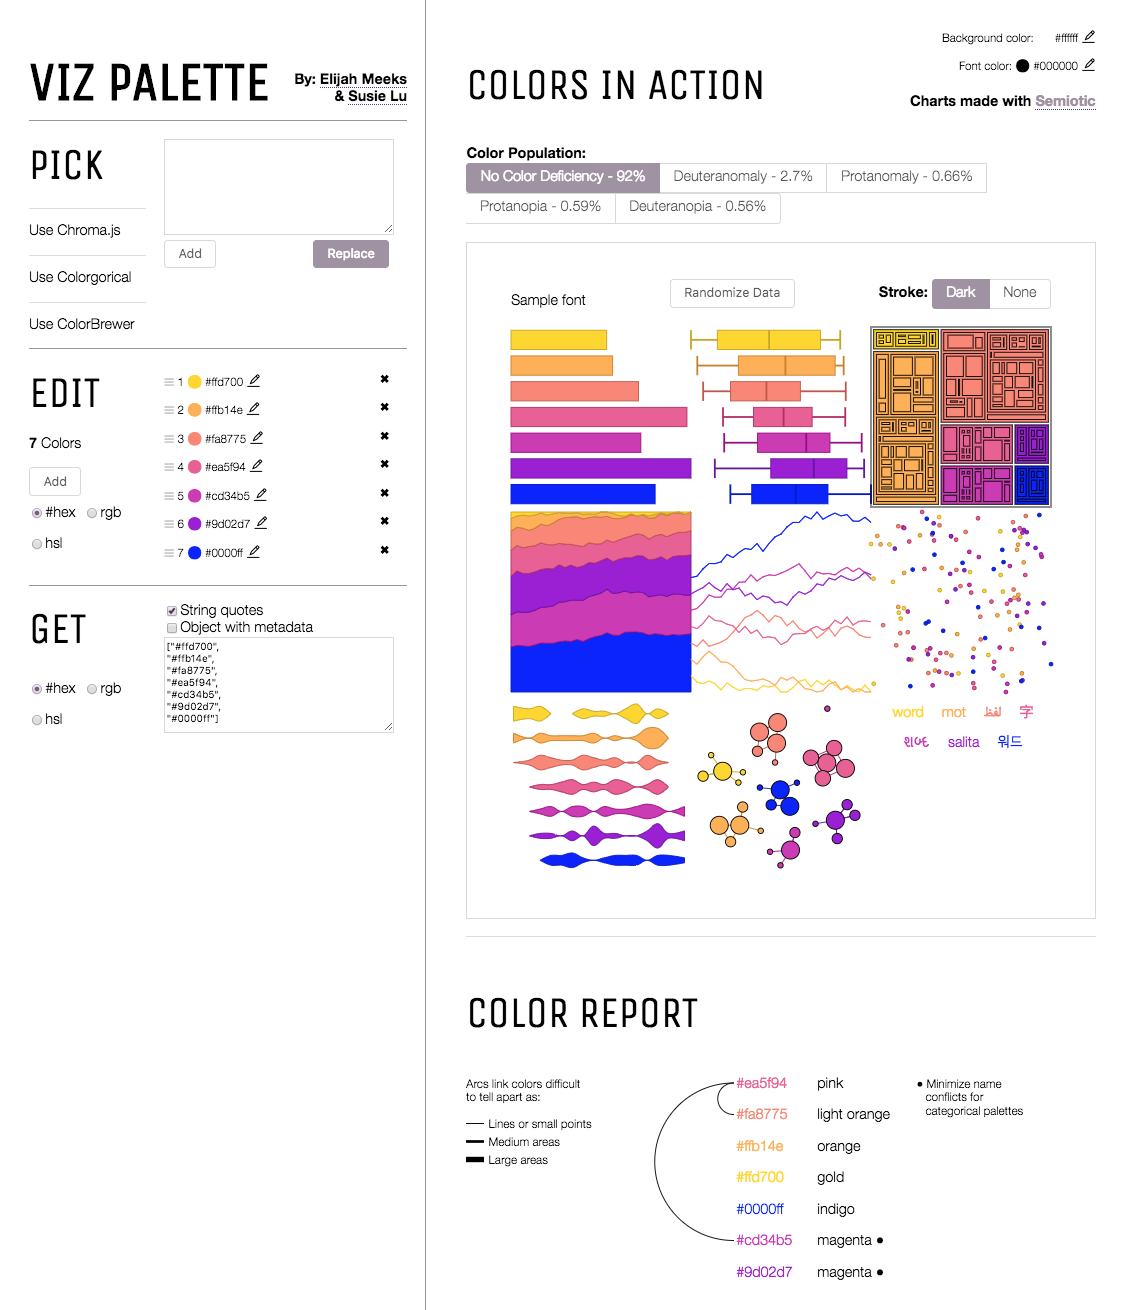
Born out of a frustration with picking colors for data visualizations. This project is optimized for tweaking, copying, and pasting in and out of JavaScript.
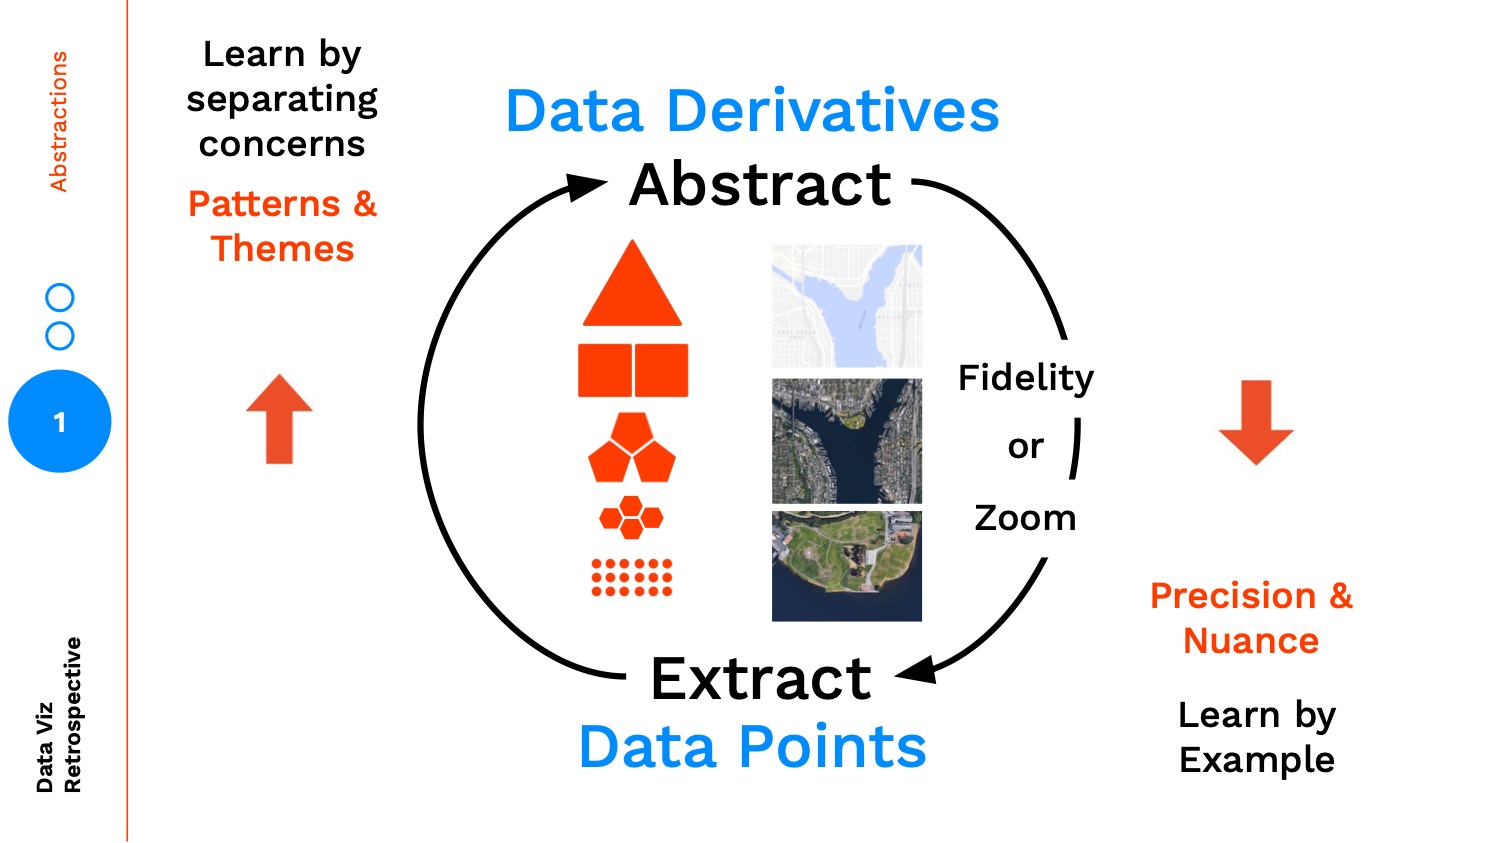
Commonly explanatory data visualization e.g. scrollytelling is framed has having a story, and exploratory data visualization e.g. dashboards is framed as not having a story.
This post examines that framing in three sections:
Why does framing exploratory viz as a form of storytelling matter?
Why are dashboards more suited for branching narrative?
How do I design storytelling in dashboards effectively?
react-annotation
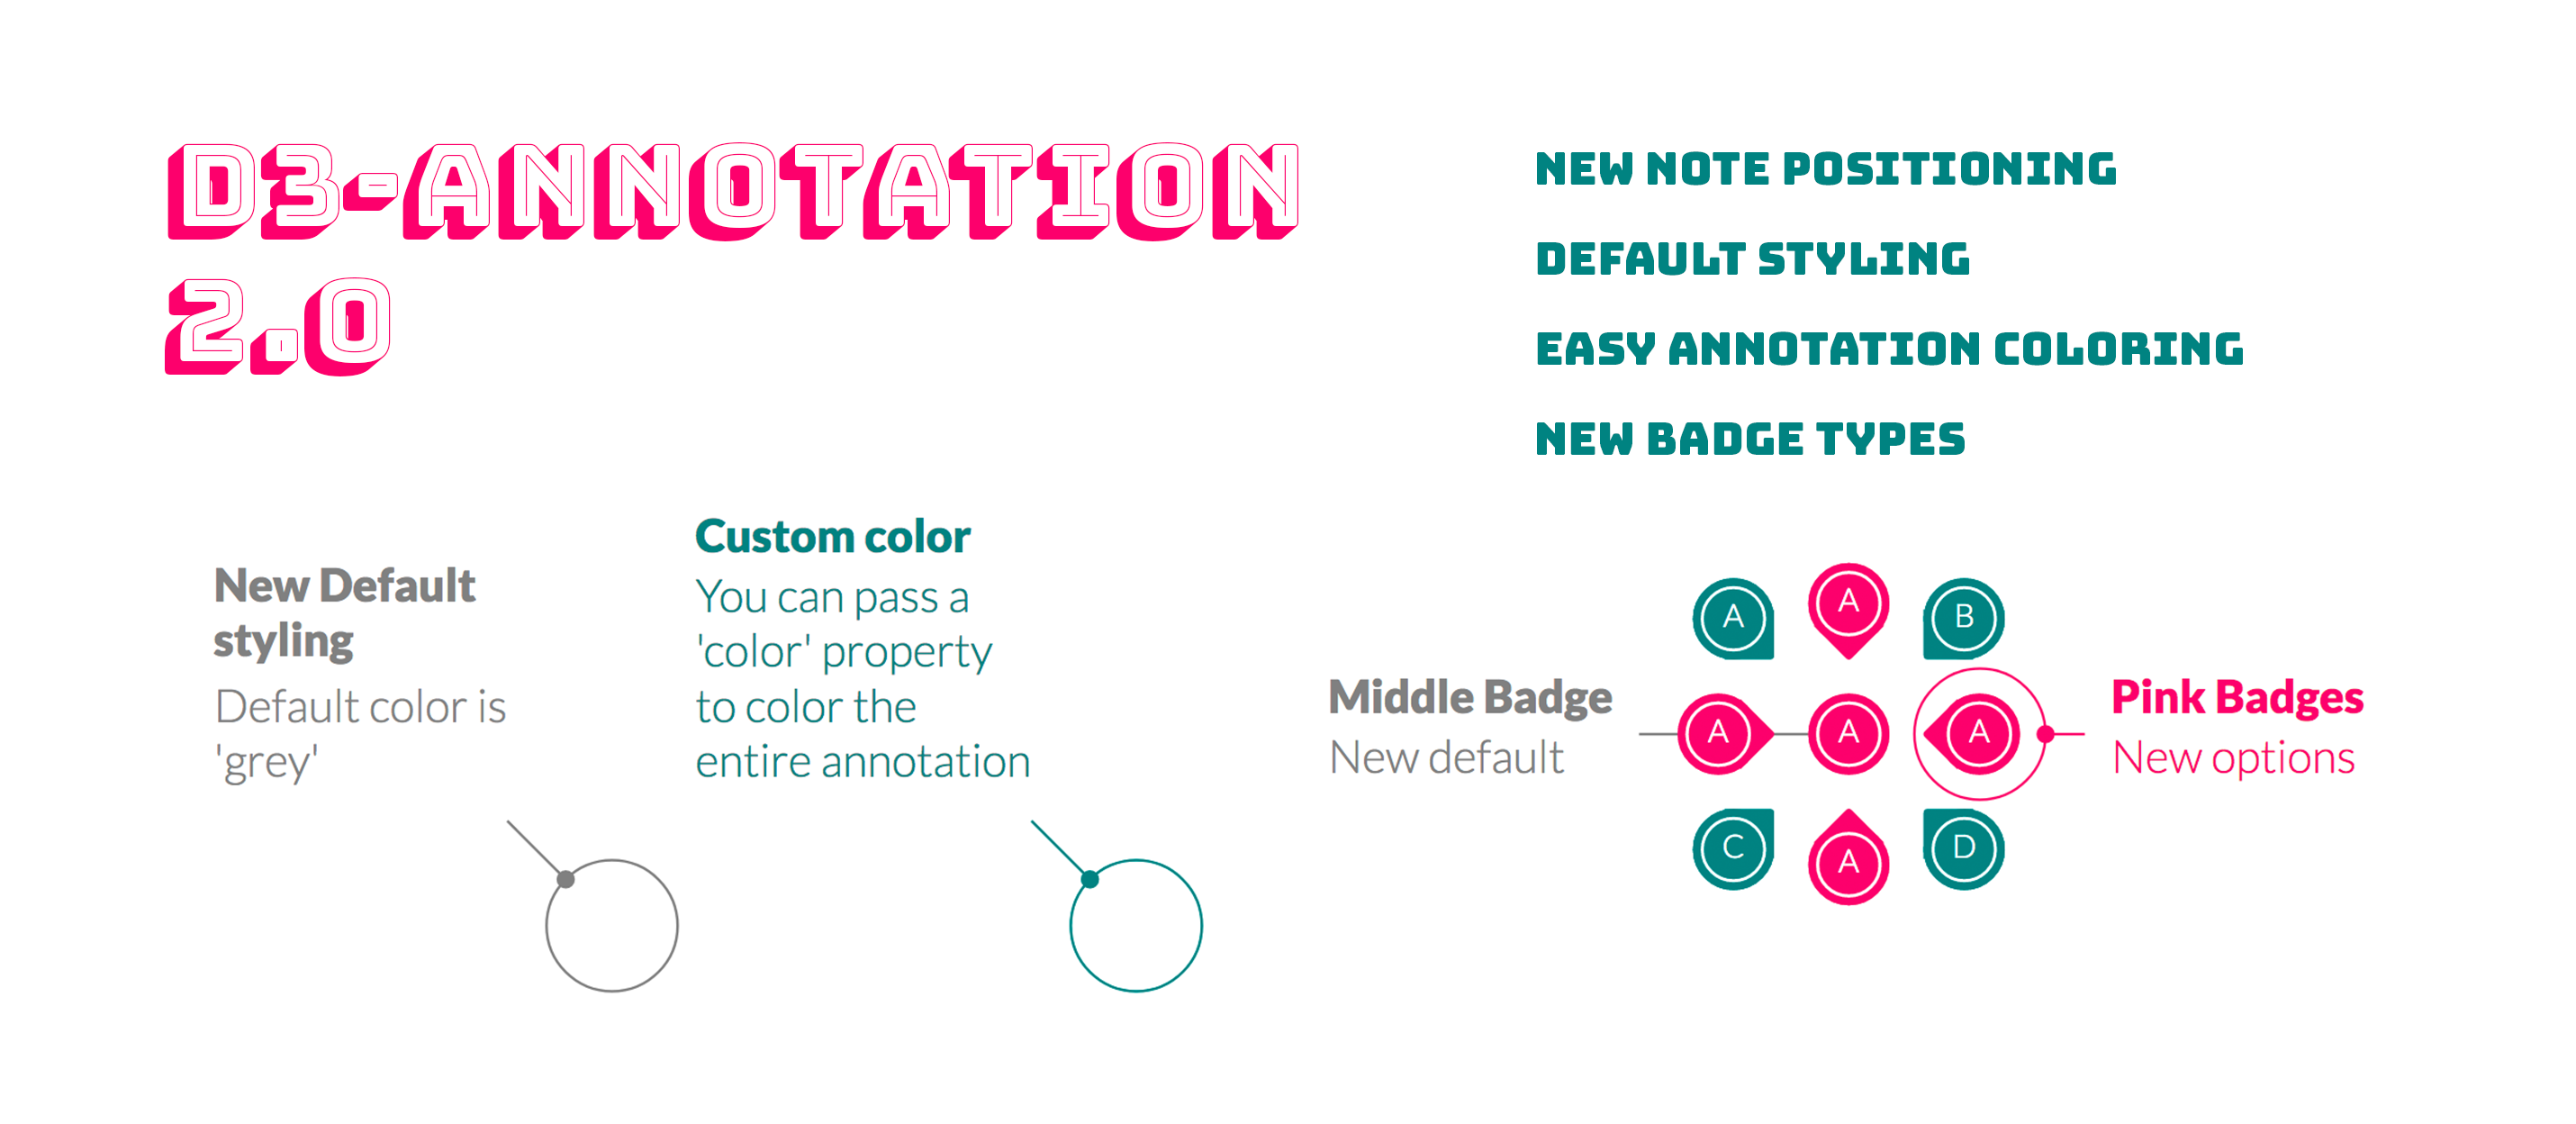
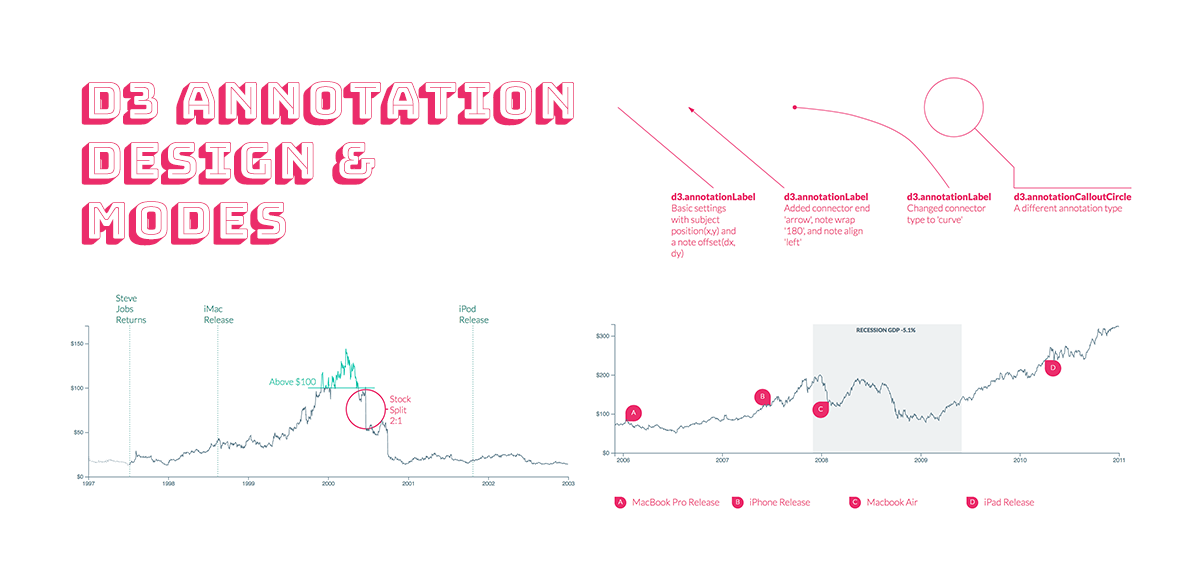
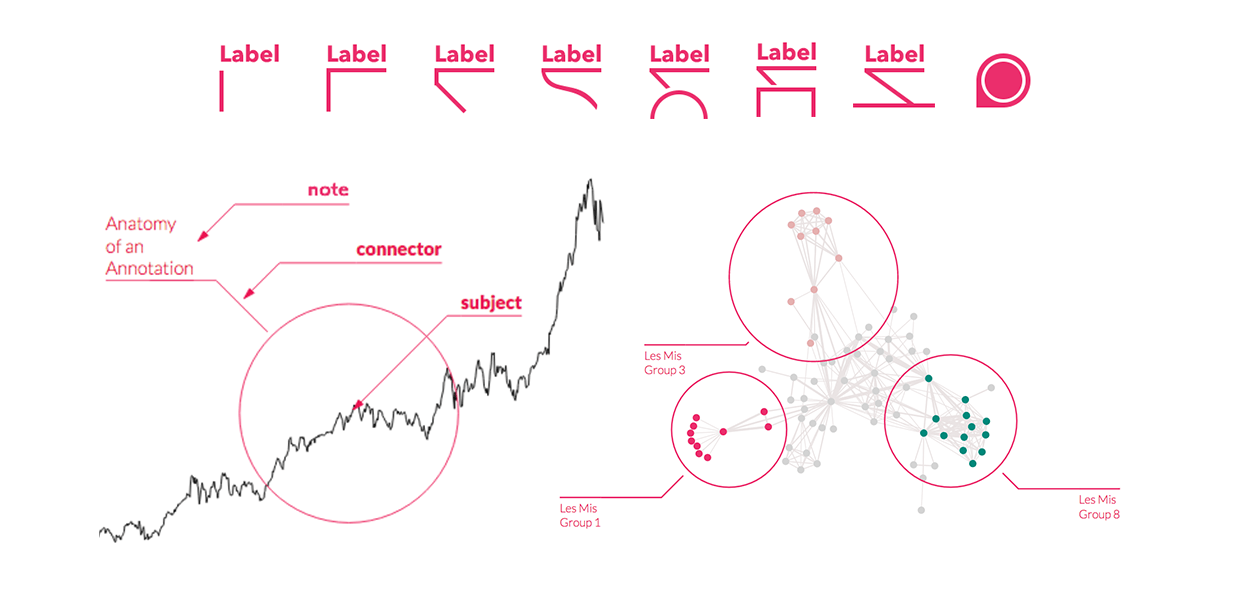
Annotations establish context, and direct our users to insights and anomalies. I made d3-annotation to tackle this problem, however most of our apps are built in React. The design is heavily based on d3-annotation, with a few differences, two new annotation types, and easy to compose annotations.
The goal of this upgrade is to make the library easier to use. The main change is custom styling is built in, no longer needing a css file, and you can set a color property to change the color of the entire annotation for easy styling.
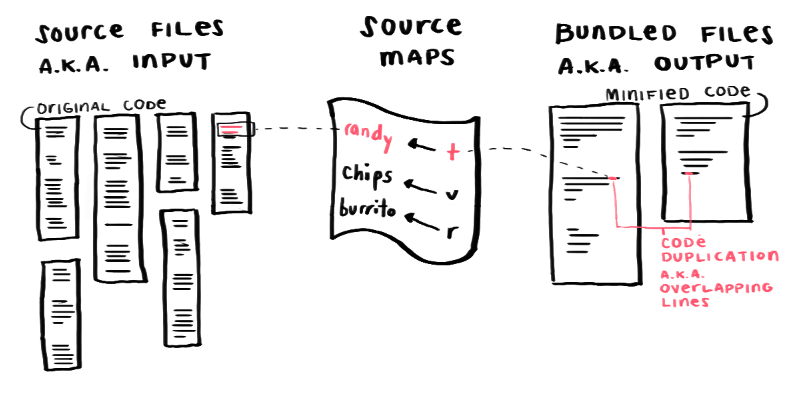
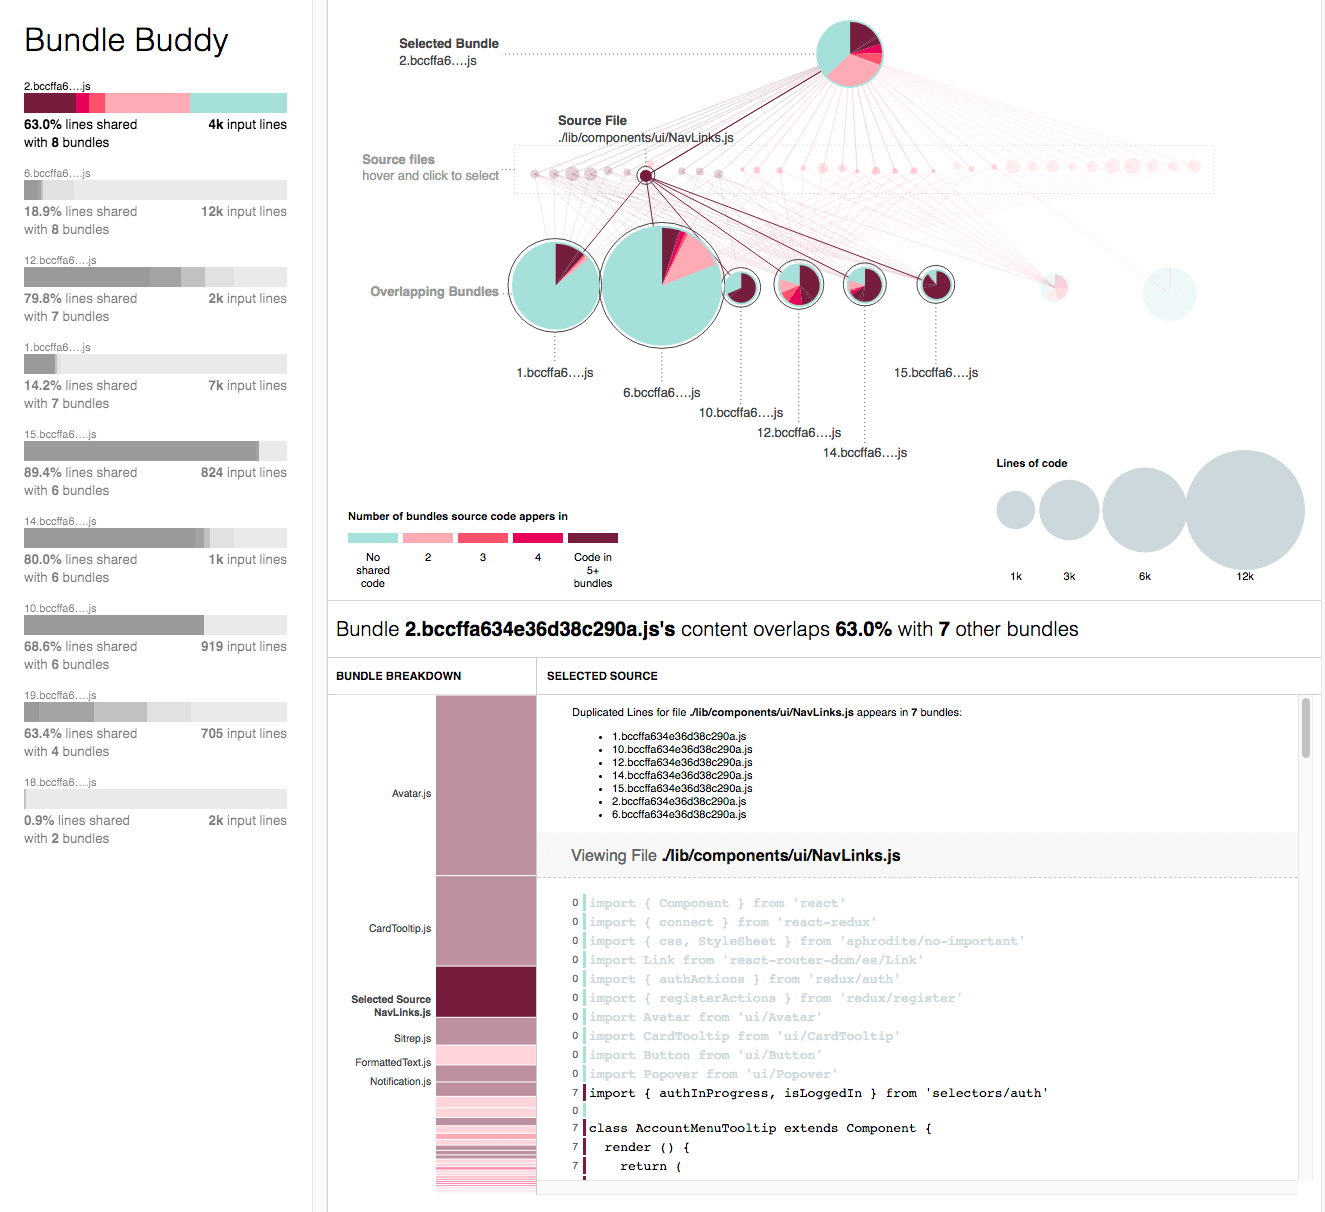
When building a complex JavaScript application, it is common to minify code and bundle files together to optimize network requests so the app loads faster.
To help with this balancing act, Sam and I made Bundle Buddy (demo) specifically to determine if your bundles are duplicating too much code at the cost of reducing the file count.
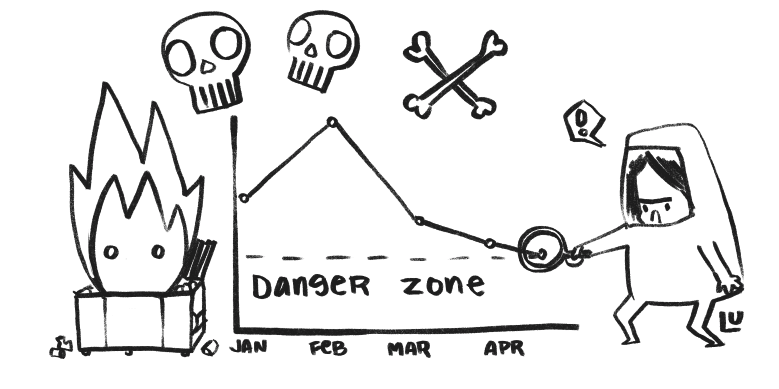
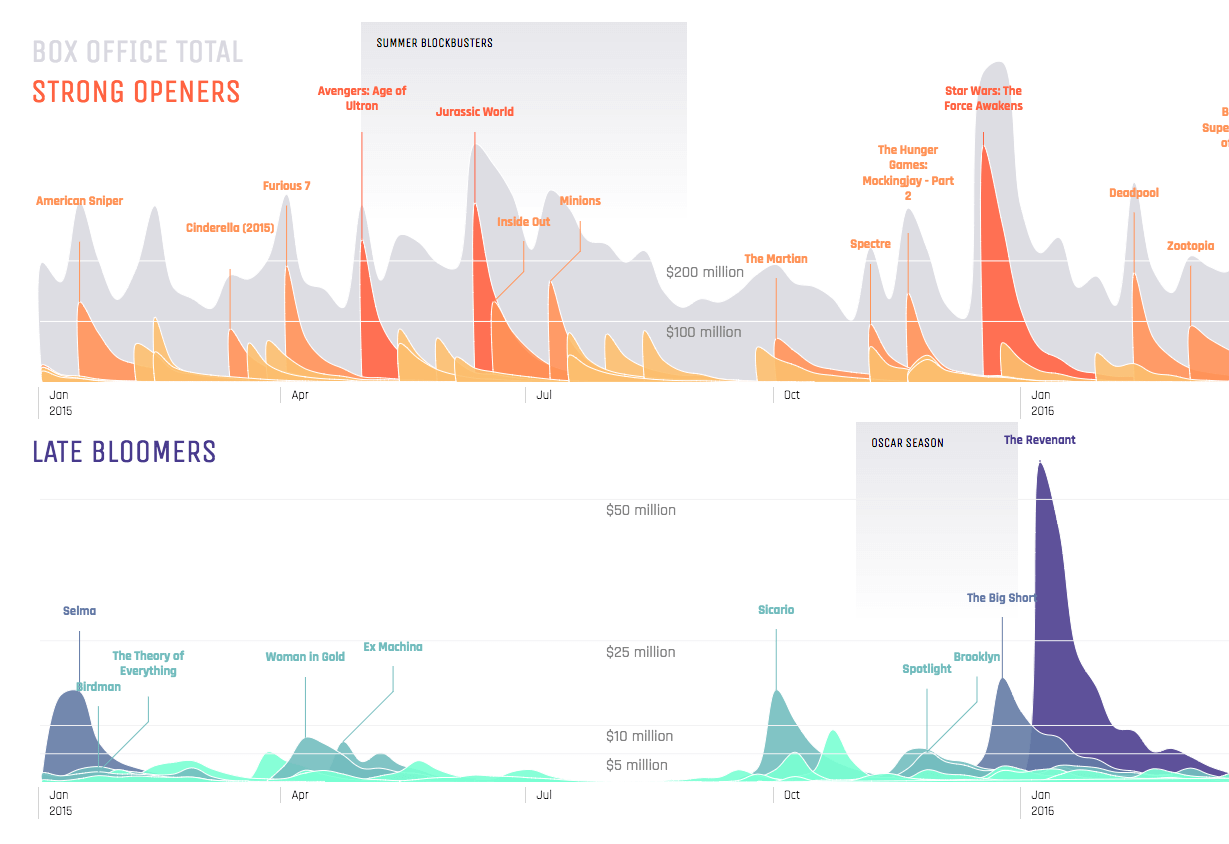
In today's data visualizations, annotations are few and far between. When you do see them they are all styled the same and only discussed as part of the final product in a context-setting mode.
There are many more ways they could be used to better communicate with our audiences. In this post I discuss two topics Annotation Design and Annotation Modes to explore more uses for annotations.
d3 Annotation
A d3 module
Annotations establish context, and direct our users to insights and anomalies. So why are annotations so few and far between in visualizations on the web? Because implementing annotations is difficult.
But it shouldn't be.
Use d3-annotation with built-in annotation types, or extend it to make custom annotations. It is made for d3-v4 in SVG.
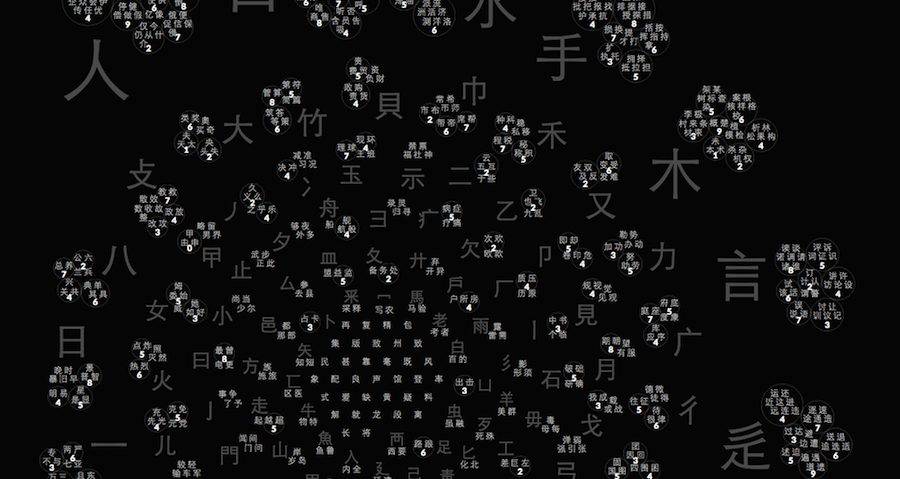
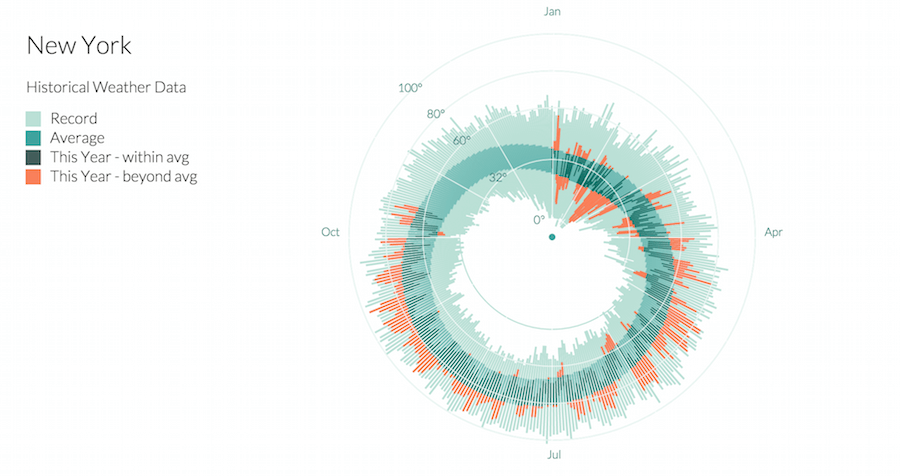
This example uses scales to roll your own radial projection by mapping out the x, y, and r positions.
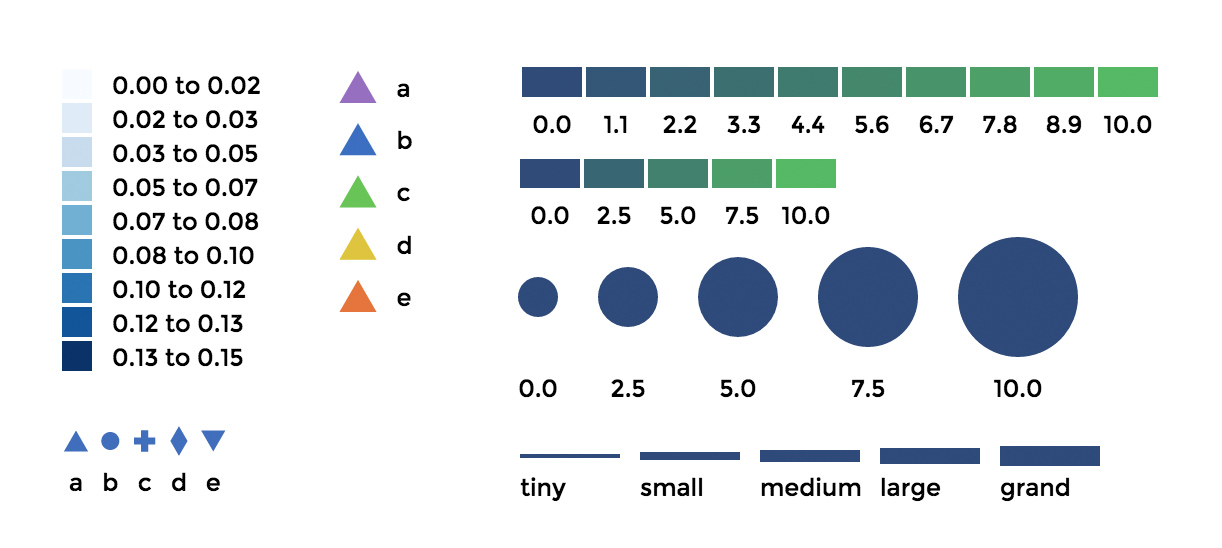
d3 Legend
A d3 module
Tired of making legends for your data visualizations? This is a legend component for d3 that creates color, size, and symbol legends based on the d3.scale you pass it.
Someone recently asked me about my process from brainstorming through to delivery; it was a great question without a very straightforward answer so I wanted to share my thoughts more broadly and invite others to do the same.
To start, I interview the customer to understand the end goal. (This can also be conversation with yourself if it’s a personal project). Aside from understanding the background information, I always want to learn the following: What is the main point we want to make to our audience? If there are multiple goals, how can we prioritize them? Knowing these answers helps me decide on the hierarchy of ideas to visually emphasize. At this stage, there is very little discussion about the look and feel. That will emerge with time: the longer you can postpone pigeon-holing the design, the better.